
Whether you are a researcher, scientist, educator, or journal author, you can use it across many disciplines. From biology and chemistry to physics and environmental science, you get tool that help you present ideas clearly and visually.
Turn Complex Ideas into Clear Visuals
Scientific concepts can become complicated very quickly. Explaining them with text alone often leaves your audience confused or overwhelmed. With Icograms Designer, you can translate those ideas into visuals that make immediate sense. You can build diagrams that guide the eye naturally and help readers understand relationships between elements. Instead of forcing your audience to imagine structures, you show them clearly and effectively.Present Data That People Actually Understand
Data sits at the core of your research, but raw numbers rarely tell a clear story. You need to shape them into something readable and meaningful. When your visuals are well designed, your audience spends less time decoding numbers and more time understanding your conclusions. That makes your work far more impactful.Build Accurate and Detailed Scientific Diagrams
You often need diagrams to explain setups, systems, or structures. Whether you are illustrating a laboratory experiment or mapping an ecosystem, clarity is essential. Icograms Designer gives you access to a large library of icons and elements that you can combine. You can adjust colors, sizes, and layouts to match your needs. This flexibility helps you create visuals that look professional and remain scientifically accurate.Show Your Research Process Step by Step
Your methodology matters, but long explanations can be difficult to follow. To present your process clearly and visually, you can create flowcharts and timelines that guide readers through each stage of your research. Whether you're describing a method or showing experimental steps, your audience will be able to easily follow the process.Create Visual Abstracts That Capture Attention
First impressions matter, especially in scientific publishing. A strong visual abstract can instantly communicate the essence of your work. Using Icograms Designer, you can design a single illustration that summarizes your study. By combining icons, diagrams, and key elements, you help readers quickly grasp your main idea and encourage them to explore further.Scientific Visuals Created by Our Users
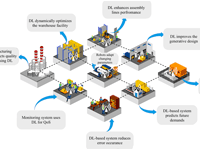
Explore how other researchers are already using Icograms Designer to bring their work to life.


Get Started Today!
When you use Icograms Designer, you are not just adding visuals. You are improving how your research is communicated. Clear illustrations reduce confusion, highlight key points, and make your work more accessible to a wider audience.You can freely use graphics created with Icograms Designer in non-commercial scientific publications with proper attribution. If you need a commercial license or higher-resolution images, feel free to contact us and we’ll be happy to provide a discount coupon.


")


