Process & Workflow Visualization

Turning Processes into Stories People Understand

Our unique online designer with thousands of icons allows to create illustrations by yourself. It's easy and free to try.

What you can create using Icograms Designer

In today's fast-paced business environment, organizations are constantly seeking ways to streamline their processes, optimize efficiency, and improve communication. Visual representations, such as product flow diagrams, play a crucial role in achieving these goals. With Icograms Designer, you can effortlessly create powerful and engaging product flow diagrams that enhance your understanding of processes, foster collaboration, and drive continuous improvement. Let's explore how Icograms Designer can transform your approach to process analysis and streamline your operations.

Why Processes Love a Visual Touch

A process is more than a list of steps—it’s the backbone of how things get done. But when you try mapping it out in words, you often lose people halfway through. That’s why turning it into a workflow visualization works so well. An infographic or an isometric diagram transforms boring text into a visual story.

You might be mapping out how a product moves through a factory, how customers travel through a service journey, or how a project team shares tasks. When you use visuals, you not only simplify the explanation—you make it stick. People remember images faster than bullet points. Think of it as giving your process a personality instead of keeping it trapped in a spreadsheet.

From Product Flow to Journey Maps

Imagine you’re explaining your product flow: raw materials arrive, production starts, testing happens, shipping follows, and finally, happy customers receive the goods. Now picture that same explanation as a colorful image with icons, arrows, and neatly designed layouts. The difference is striking.

A journey map works in a similar way. It’s not just about steps, it’s about experiences. By mapping the journey visually, you see bottlenecks, handovers, and opportunities for improvement. Whether it’s a supply chain or a user experience, visualizing the flow makes it easier to spot what works and what doesn’t.

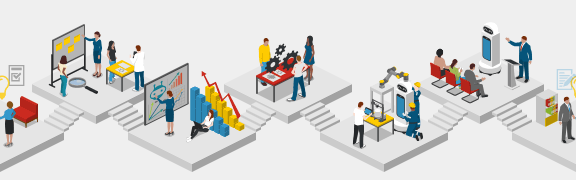
Infographics: Small Art with Big Impact

Think of infographics as the quick storytellers of the process world. They mix words and visuals into one easy-to-grasp picture, so instead of flipping through pages of explanation, you get the idea in seconds.

Now, throw in some isometric style and the magic really happens. You suddenly have depth, perspective, and a scene that feels alive without being cluttered. Whether it’s a buzzing factory, a busy office, or even a digital workflow, isometric images make you feel like you’ve stepped right into the process instead of just staring at flat lines and arrows.

Mapping Doesn’t Have to Be Boring

Mapping a process often sounds like paperwork and meetings, but with the right tools it becomes creative. You’re not just documenting—you’re designing. By treating workflow diagrams as art, you bring clarity and creativity together.

That’s why journey mapping, workflow design, and product flow infographics are so popular today. They look good, but more importantly, they make sense. A good map lets everyone see the same picture, which is priceless when teams need to align fast.

Your Next Step: Visualize It

The next time you catch yourself writing down a workflow in endless lines of text, stop and ask: could this be a picture? Turn that process into an infographic, map your journey, or try an isometric art style to give it extra dimension.

When you transform workflows into visuals, you’re not just explaining—you’re connecting. You’re guiding people through a journey that’s easy to understand, enjoyable to follow, and even inspiring. Because let’s face it, processes aren’t boring when they’re visualized as art—they’re stories waiting to be told.

How to work with Icograms Designer

Icograms Designer is an online vector graphic editor with an extensive built-in graphics collection. Our graphic library currently contains over 1,132 icons and 5,371 templates across a wide range of categories. This collection is continuously growing as we regularly add new icons and templates.

You can start your project from scratch or customize one of our templates.

To get started from scratch

  • Open Icograms Designer
  • Drag and drop icons to the work area
  • Utilize clone tools and copy/paste functions to increase efficiency
  • Move, resize, and recolor icons to find the best solution
  • Add text and symbols to enhance your design.
  • Upload your own graphics if needed
  • Export the created graphics

To get started from a template

  • Choose a suitable template
  • Drag and drop additional graphics if necessary
  • Insert your own text using text boxes
  • Customize your design by changing colors, fonts, and icons
  • Upload your own graphics if needed
  • Export the created graphics

Process & Workflow Visualization related Templates

Microbiology Laboratory - From Sample to Result
Premium template icon Hospital Patient Journey
Healthcare Customer Journey Mapping
Patient Journey Map
Plastic Recycling Process
Organic Waste Recycling Process
Waste Management  Recycling  Process
Reverse Logistics In Supply Chain Management
Garbage Recycling Process
Logistics and Reverse Logistics
E-Waste Recycling Process
Premium template icon Green Supply Chain
Sustainable Supply Chain
First Mile, Middle Mile, and Last Mile Logistics
Ketchup Supply Chain
Last-mile delivery
Last-mile delivery process
Premium template icon Printing process
Flowers Cold Chain Logistics: Farm to Vase
Manufacturing Process Monitoring
Wind Farm Diagram
Premium template icon Cold Chain Logistics
Production Monitoring
3PL (Third Party Logistics)
Premium template icon Production Process Monitoring
FTTx - Fiber to the x
Premium template icon Blockchain Technology in Food Supply Chain
Premium template icon Car Assembly Line
Air Traffic Control Systems
PON - Passive Optical Network
Premium template icon Blockchain in Food Supply Chain
Premium template icon Car Manufacturing Process
Airport Passenger Journey
Offset Printing House
Building Management System
Direct Air Carbon Capture
BMS
BMS - Building Management System
Premium template icon Intrusion Detection System
Intrusion Detection Sensors
Door Access Control
Delivery Elements
Automotive Supply Chain
Premium template icon Airport Identity Verification Process
Carbon Capture and Utilization
Premium template icon Car Factory - Assembly Line
Premium template icon Sugar Production Diagram
Air Travel Journey Infographic
Food Delivery Process
Order Processing
Non Emergency Medical Transportation
Premium template icon Farm Cheese
Premium template icon Juice Supply Chain
Red wine production
Cheese Production
Olive Oil Manufacturing
Vegetable Processing Line
Fish Processing Line
Bread Making Stages
Cookies Line
Premium template icon Rainbow Trout Farming
Road Construction
Premium template icon Food Supply Chain
Food Production Chain
Start start-up
Steps to Perfect Vacation
Multimodal Transportation Modes
Process Diagram
Taxi Service Workflow Diagram
Construction Stages
Premium template icon Bread Line
Warehouse Management
Farm To Table
Pharmaceutical Supply Chain
Pick, Pack, Ship 2
Six degrees of separation
Premium template icon Supply Chain Diagram
Supply Chain Management
Website cookies
Premium template icon Future Technologies
Pick, Pack, Ship
Water Cycle Diagram
Order Fulfilment
Automated Emergency Response System
Order Fulfilment Process
Automated Emergency Response System 2
On-Grid vs Off-Grid Solar Systems
Offshore Wind
GPS for Emergency Services
Premium template icon Offshore Wind Energy
Global Positioning System
Offshore Grid Connection
Premium template icon Car Factory
Premium template icon From Beet to Sugar
Premium template icon Recirculating Aquaculture Systems
Woman Shopping - Man Shopping
GMDSS
Premium template icon Urban Water Cycle
Remote Health Monitoring
Premium template icon Methanol Synthesis
Premium template icon Electricity Supply Chain
Premium template icon SSAS
Premium template icon Parking Monitoring System
Water Supply Chain
Remote Health Monitoring System
Premium template icon Biomethane Chain
Premium template icon Electricity Supply 2
Dinosaur Board Game
Ship Security Alert System
Automatic Parking
Premium template icon Smart Water Management
Premium template icon Energy Loss in Electricity System
Premium template icon Cross Docking Warehouse
Premium template icon Warehouse Sorting System
Water Supply Chain Management
Premium template icon Green Ammonia Production
Vessel Monitoring System
Premium template icon Distribution Center Diagram
Warehouse Management 2
Smart Parking System
Drinking Water Cycle
Premium template icon Ammonia Production
Maritime Communications
Premium template icon Cross Docking
Automatic Parking System
Weather Station
Small Smart Farm
Premium template icon Green and Blue Ammonia
AIS
Premium template icon Baggage Handling System
Lettuce Supply Chain
Carbon Cycle
Premium template icon The Colors of Hydrogen
Electricity Supply
Electricity Delivery
Premium template icon LPG Supply Chain
Waste Management
Automatic Weighbridge
Supply Chain
Food Supply Chain 2
Milk-run operations
Individual deliveries
Groupage transporting
Premium template icon The cost of the benefits of civilization
How to use Icograms
Hydrogen Colors
Premium template icon Restaurant Technologies
Earth Air Tunnel 2
Hydroponic Farming
Connected Automated Vehicles
Premium template icon Urban Heat Island Effect
3D Printing Technology
International Beer Day
Grey Green Blue Hydrogen
Premium template icon Fast Food Drive
Wheat Timeline Template
Premium template icon Earth Air Tunnel
Post-Fire Hazards
Post-Fire Hazards Infographics
Premium template icon How Self Driving Car Sees
How Self Driving Car Recognize Objects
Winemaking Difference
From biowaste to energy and heat
Biogas Plant Configuration
Building Construction Process
Hydrogen Production
Bakery
Premium template icon L-Shaped Warehouse
Premium template icon U-Shaped Warehouse
Premium template icon I-Shaped Warehouse
Wine Production
Olive Oil Production
Integrated Air Defense System
Fish Processing Steps
Template Manufacturing
Bread Baking