Infographics Elements

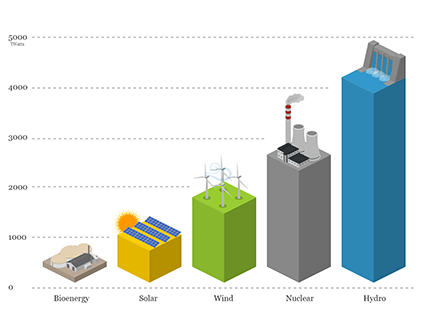
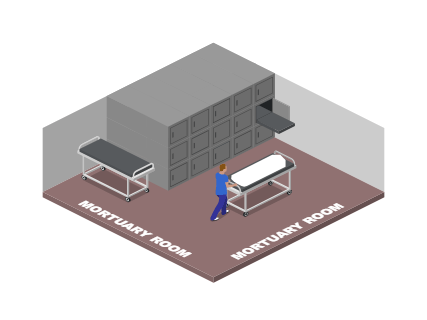
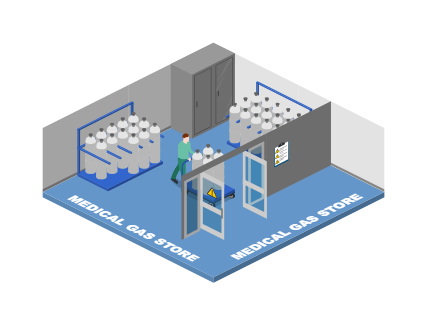
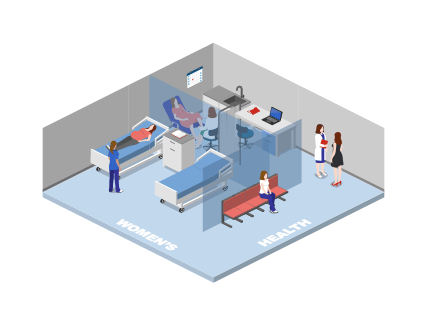
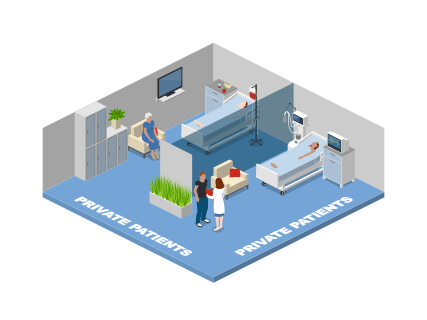
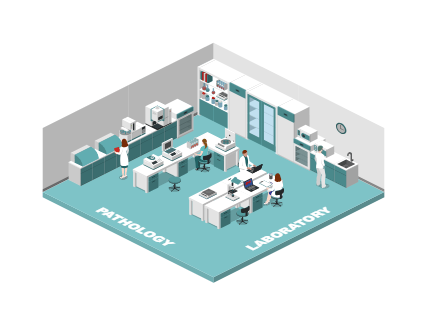
We have a wide variety of icons that can be used as elements in infographics.

Our unique online designer with thousands of icons allows to create illustrations by yourself. It's easy and free to try.

What you can create using Icograms Designer

Infographics are graphic visual representations of information, data, or knowledge designed to present information quickly and clearly. They enhance cognition by leveraging visuals to improve the human visual system's ability to perceive patterns and trends.

Regardless of the type of infographics you create, clarity is paramount for users. Our extensive collection of icons will assist you in creating infographics that are both clear and visually appealing. Our icons span numerous industries and areas, including agriculture, logistics, transportation, warehousing, construction, IT/network, power energy, factory, interiors, healthcare, office, events, and more.

How to work with Icograms Designer

Icograms Designer is an online vector graphic editor with an extensive built-in graphics collection. Our graphic library currently contains over 976 icons and 4,875 templates across a wide range of categories. This collection is continuously growing as we regularly add new icons and templates.

You can start your project from scratch or customize one of our templates.

To get started from scratch

  • Open Icograms Designer
  • Drag and drop icons to the work area
  • Utilize clone tools and copy/paste functions to increase efficiency
  • Move, resize, and recolor icons to find the best solution
  • Add text and symbols to enhance your design.
  • Upload your own graphics if needed
  • Export the created graphics

To get started from a template

  • Choose a suitable template
  • Drag and drop additional graphics if necessary
  • Insert your own text using text boxes
  • Customize your design by changing colors, fonts, and icons
  • Upload your own graphics if needed
  • Export the created graphics

Infographics Elements related Templates

Effects of Air Pollution
Air Pollution Sources
Natural Disasters
Natural Disasters
Generators/Substations
Sport Festival Zones
Festival Zones
Festival Zones
Delivery Elements
Delivery Elements
Office Elements
Office Elements
Supermarket Elements
Healthcare Infographic Elements
Inside the Warehouse
Warehouse Infographic Elements
Warehouse Elements
Warehouse Elements
Shipping Containers
Shipping Containers
Railroad Infographic Elements
Construction Infographic Elements
Office Icons
Office Icons
Cloud Icons
Cloud Icons
Pie Chart
Pie Chart
Transport Bar Graph
Transport Bar Graph
Doughnut Chart
Doughnut Chart
Bar Chart
Bar Chart
Airport Components
Airport Components
Airport Terminal Configurations
Green Infrastructure Components
Augmented Reality - City
Urban Heat Island Effect
Animals
Animals
City Traffic 01
City Traffic 01
City Traffic 02
City Traffic 02
SEO Analysis Icons
SEO Analysis Icons
Data Analysis
Data Analysis
Career Ladder
Career Ladder