Chart Infographics

Create unique chart infographics using docking graphic blocks.

Our unique online designer with thousands of icons allows to create illustrations by yourself. It's easy and free to try.

What you can create using Icograms Designer

Unlock the power of data visualization with Icograms Designer and create Chart Infographics that captivate and inform. Present your data in a visually appealing and meaningful way, making complex information accessible and memorable. Elevate your data storytelling with Icograms Designer, the ultimate companion for creating impactful chart infographics.

How to work with Icograms Designer

To get started from scratch

  • Open Icograms Designer
  • Drag and drop icons to the work area
  • Utilize clone tools and copy/paste functions to increase efficiency
  • Move, resize, and recolor icons to find the best solution
  • Add text and symbols to enhance your design.
  • Upload your own graphics if needed
  • Export the created graphics

To get started from a template

  • Choose a suitable template
  • Drag and drop additional graphics if necessary
  • Insert your own text using text boxes
  • Customize your design by changing colors, fonts, and icons
  • Upload your own graphics if needed
  • Export the created graphics

We created Icograms Designer with the goal of helping people easily create infographics, isometric maps, diagrams, and illustrations. However, its capabilities go beyond that. All graphics are in vector format, making it perfect for printing. You can export the graphics and use them in various applications, presentations, documents, websites, games, videos, and more.

Currently, our graphic library consists of over 4620 icons and 904 templates covering a wide range of categories such as Festivals, Sports, Agriculture, Logistics, Transportation, Warehousing, Construction, IT / Network, Power Energy, Factory, Manufacturing, Interiors, Healthcare, Office, and more.This collection is continuously growing as we regularly add new icons and templates. If you still need something unique and specific, we also offer the option to order personalized graphics.

Unleash your creativity and explore the countless possibilities with Icograms. Do you have an idea in mind? Visit Icograms Designer and bring it to life!

Chart Infographics related Templates

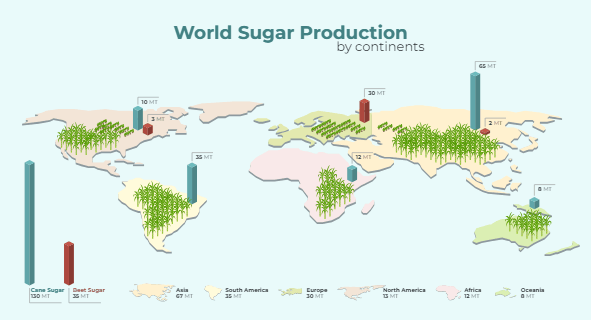
World Sugar Production by Continents
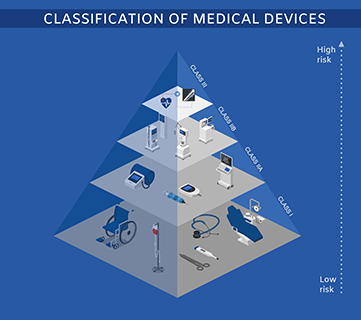
Classification of Medical Devices
Pie Chart
Pie Chart
Transport Bar Graph
Transport Bar Graph
Doughnut Chart
Doughnut Chart
Bar Chart
Bar Chart
Career Ladder
Career Ladder
Tree Diagram
Tree Diagram
Success Concept
Success Concept
Steps to Success
Steps to Success
Company Structure
Company Structure
Transportation - Agriculture - Cargo
Student Ladder
Student Ladder