Statistical Infographics
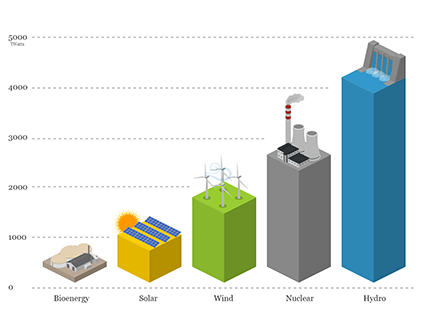
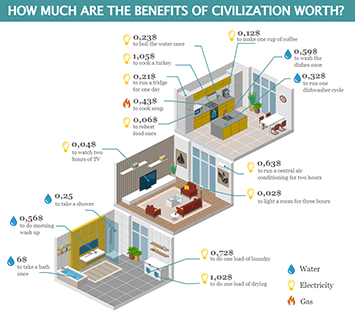
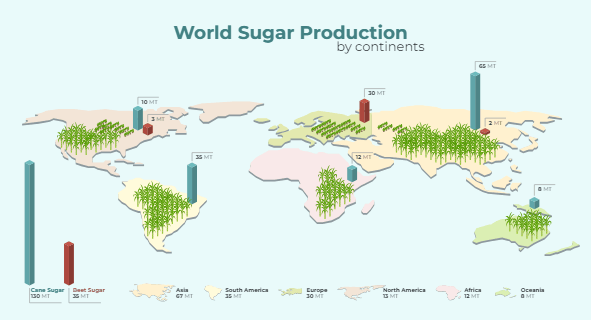
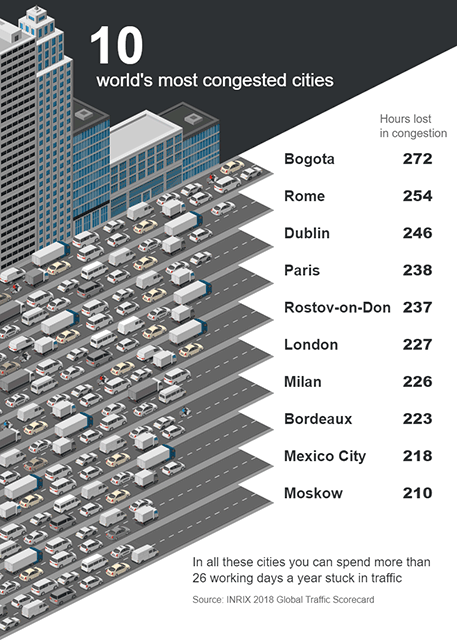
Statistical infographics are based on data, but good graphics can make them more visually appealing.
Our unique online designer with thousands of icons allows to create illustrations by yourself. It's easy and free to try.
What you can create using Icograms Designer
Creating Statistical Infographics with Icograms Designer is both intuitive and efficient. The user-friendly interface allows you to drag and drop elements, adjust their positions, and fine-tune the visual details with precision. This enables you to craft visually compelling infographics that effectively communicate your data story.
How to work with Icograms Designer
You can start your project from scratch or customize one of our templates.
To get started from scratch
- Open Icograms Designer
- Drag and drop icons to the work area
- Utilize clone tools and copy/paste functions to increase efficiency
- Move, resize, and recolor icons to find the best solution
- Add text and symbols to enhance your design.
- Upload your own graphics if needed
- Export the created graphics
To get started from a template
- Choose a suitable template
- Drag and drop additional graphics if necessary
- Insert your own text using text boxes
- Customize your design by changing colors, fonts, and icons
- Upload your own graphics if needed
- Export the created graphics
